Mastering Analytics & Reporting: A Step-by-Step Guide to Data Mastery

In today's data-driven world, mastering Analytics & Reporting is a game-changer for professionals across industries. Whether you're a beginner or looking to refine your skills, this guide will walk you through the essential steps—from understanding fundamental data concepts to leveraging advanced predictive analytics. By the end, you'll have the tools to transform raw data into actionable insights. View original learning path
Step 1: Fundamental Concepts
Before diving into complex analyses, it's crucial to grasp the basics. Start with **Data Types**, which include numerical (e.g., sales figures), categorical (e.g., product categories), and textual data (e.g., customer reviews). Understanding these helps you choose the right analysis methods. Next, focus on **Data Collection**, the process of gathering data from sources like surveys, databases, or APIs. Ensure your data is reliable and relevant to your goals.
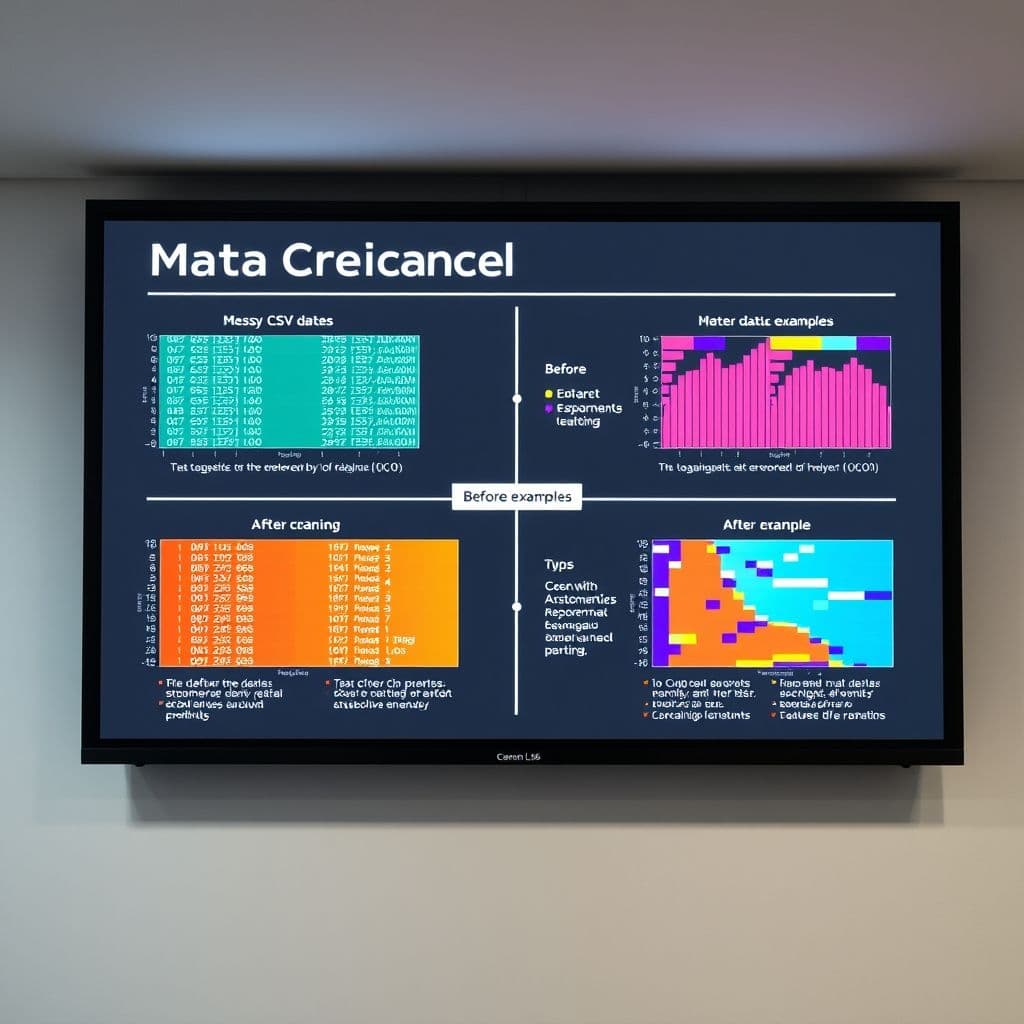
**Data Cleaning** is where many beginners stumble. This step involves handling missing values, removing duplicates, and correcting inconsistencies. For example, if your dataset has entries like 'USA' and 'United States,' standardize them to avoid confusion. **Data Transformation** follows, where you convert raw data into a usable format, such as aggregating daily sales into monthly totals. Finally, **Data Visualization** brings your data to life through charts, graphs, and dashboards. Tools like Excel, Tableau, or Power BI can help you create clear, impactful visuals.

✨ Build your personalized learning path in seconds with AI
Try SkillAI for Free →Step 2: Intermediate Concepts
Once you're comfortable with the basics, it's time to explore **Statistical Analysis**. This involves summarizing data (mean, median, standard deviation) and identifying patterns. For instance, calculating the average customer spend helps you understand purchasing behavior. **Hypothesis Testing** allows you to test assumptions, like whether a new marketing campaign increased sales significantly.
**Regression Analysis** examines relationships between variables, such as how advertising spend impacts revenue. **Time Series Analysis** is perfect for trend forecasting, like predicting future sales based on historical data. Lastly, **Segmentation Analysis** groups similar data points—think dividing customers into segments based on demographics or behavior—to tailor strategies effectively.

Step 3: Advanced Concepts
At the advanced level, **Machine Learning** takes center stage. Algorithms like decision trees or neural networks can predict outcomes, such as customer churn. **Predictive Analytics** builds on this, using historical data to forecast future events—like inventory demand. **Data Mining** uncovers hidden patterns in large datasets, while **Text Mining** extracts insights from unstructured text (e.g., social media comments).
Finally, **Big Data Analytics** handles massive, complex datasets often requiring tools like Hadoop or Spark. For example, analyzing real-time sensor data from manufacturing equipment to predict failures. These techniques empower you to make data-driven decisions at scale.
Conclusion
Analytics & Reporting is a powerful skill that evolves from understanding basic data types to leveraging advanced machine learning. By mastering each step—fundamentals, intermediate techniques, and advanced applications—you'll unlock the ability to turn data into strategic insights. Remember, consistency and practice are key to becoming proficient.
Ready to put these concepts into practice? Start by cleaning a small dataset and visualizing it. Share your results in the comments!
🚀 Create Your Free Learning PathFrequently Asked Questions
- How long does it take to master Analytics & Reporting?
- It varies based on your starting point and practice frequency. Beginners can grasp fundamentals in a few weeks, while advanced techniques may take months of dedicated learning and application.
- What are common mistakes beginners make?
- Skipping data cleaning, using inappropriate visualizations, or jumping to advanced techniques without a solid foundation. Always validate your data and start simple.
- Which tools are best for beginners?
- Excel or Google Sheets for basics, Tableau or Power BI for visualization, and Python or R for advanced analysis. Choose tools that align with your goals.


